Part I: The foundations of U.S. economic preeminence, 1945-2025
America’s economy stands alone. Americans enjoy higher productivity, income, and consumption than peers in virtually any other country. At a time when many people express disenchantment with U.S.-style democratic capitalism and pessimism about the future, one vital point is too often forgotten: Economic realities are much better here than anywhere else.
This essay is the first in a six-part George W. Bush Institute-SMU Economic Growth Initiative series on how America’s distinctive model for innovation and economic growth came to be. The U.S. model has proved to be the best approach the world has ever seen for delivering rising living standards in a country at the technological frontier – that is, an economy that already employs cutting-edge technology and thus can’t advance just by importing ideas from other countries.
The American way of innovation and economic growth
America’s economic growth model has four key components:
- Aggressive investment in science, technology, and education.
- Great incentives for inventors, entrepreneurs, and businesses.
- Market expansion through infrastructure and trade.
- Unusual acceptance of creative destruction – meaning displacement of old firms and industries by new ones and reallocation of resources to leading edge firms.
The American model came into being in the early decades after World War II because of five pivotal decisions the nation’s leaders made in the immediate aftermath of the war:
- Committing to American preeminence in science and technology – federal funding through the National Institutes of Health, the National Science Foundation, the Department of Defense, and other institutions.
- Cultivating the world’s most highly educated workforce through mass higher education – the GI Bill and subsequent measures to broaden postsecondary access.
- Pursuing light-touch regulation of emerging industries rather than central planning – avoiding picking winners and losers through heavy-handed intervention and letting free markets do their work.
- Expanding markets for U.S. companies by leading reciprocal trade opening around the world – U.S. leadership through the Marshall Plan, which aided European nations after World War II, and the General Agreement on Tariffs and Trade, the world’s first multilateral trade liberalization treaty.
- Connecting and opening up the country through physical and institutional infrastructure – federal support for interstate highways, airports, power, water, hospitals, universities, medical schools, and other assets across the country.
Each of these decisions represented a bold, optimistic bet on the future and a break with prewar policies. None was inevitable. Each resulted from sustained, visionary leadership. A handful of remarkable people – mostly unknown today – played pivotal roles in making them happen. And subsequent leaders doubled down on these decisions continuously for the next 60 years. Together, they set the U.S. economy on a different course than any other major country.
This essay outlines how America’s innovation and growth model has shaped the nation’s contemporary economy. The next five parts explore the origins and development of the five decisions and how each has contributed to America’s modern-day prosperity. We tell this story because the core components of the model are as vital as ever for expanding opportunity and well-being in the United States today – and also because it’s a great story.
An economy like no other
The U.S. economy is exceptionally productive by any measure. In 2023, America’s GDP per capita and GDP per worker were both about 25% higher than the averages for 10 wealthy peer countries: Belgium, Canada, Denmark, France, Germany, Japan, the Netherlands, Sweden, Switzerland, and the United Kingdom. This analysis compares GDP in purchasing power-adjusted dollars using data from the University of California at Davis’ Penn World Table and the Organization of Economic Cooperation and Development (OECD).
Americans work about 8% more hours per year than people in the peer countries, on average, so one could argue we should compare countries for output per hour worked. But even on this measure, Americans produce 15% more than their counterparts in the 10 other countries, on average.
America also has a considerable edge in incomes earned by comparable workers. Newly minted bachelor’s degree graduates earn 25% to 35% more than new graduates in France, Germany, and the U.K., on average, and more than twice as much as Japanese graduates, based on calculations from OECD data and studies of the countries. American workers with an associate degree earn 17% to 25% more than French, German, and British counterparts with similar educational attainment, while those with just a high school diploma make 25% to 35% more.
Comparing people in the same occupation with peers in France, Germany, and the U.K.:
- U.S. construction workers make 12% more than European peers.
- Teachers make 18% more.
- Plumbers make 56% more.
- Nurses earn a remarkable 65% more.
American workers in these fields earn more than Europeans not because they’re so much more productive but because other Americans can afford to pay so much more their services.
More specific geographic comparisons are also revealing. The average worker in Alabama – one of America’s lowest-income states – earns more income than the average German worker. People in Gulfport, Mississippi, and Macon, Georgia, with average incomes well below Alabama’s, make more than the average person in France, based on data from the U.S. Census Bureau, the OECD, and the Penn World Table.
Higher incomes mean Americans can afford more goods and services than foreign peers. American homes are 89% larger than those in the 10 peer nations, on average, according to estimates from American Home Shield in 2023 and the World Population Review in 2025. The average American spends roughly 20% more on leisure travel, 21% more on consumer electronics, and 35% more on media and entertainment than foreign counterparts, according to data from Eurostat, nonprofit industry group Learn Tourism, travel research firm Skift Research, real estate analysis firm CoStar, and industry consulting and researching company Cognitive Market Research, as well as media reports.
While Americans put in more hours at work, they devote 11% less time to housework and shopping, probably because of better appliances and larger refrigerators. They also get 6% more hours of sleep each week.
Americans benefit from far greater medical resources than foreign peers and better outcomes when they become ill, contrary to common narratives that America’s health care system is worse than in peer countries. The United States has 28% more nurses per capita than the 10 wealthy peers, 33% more acute-care hospital beds, and twice as many high-tech diagnostic machines, based on OECD data for 2021. As a result, Americans have much better breast and colorectal screening rates, cancer mortality rates, and 30-day survival rates after a stroke or heart attack.
Americans do incur higher out-of-pocket health care expenses, and they transfer more income to medical providers and pharmaceutical companies through higher prices. But taking into account these differences, Americans have 20% to 25% more disposable income left over after health care costs than people in peer countries.
While the United States tolerates more inequality than most peers, Americans in the second-to-bottom fifth of the population for income – people we can broadly call “working class” – enjoy 11% to 20% more consumption of goods and services than peers in France, Germany, and the U.K., on average. Consumption levels for Americans in the bottom income quintile are in line with peers in France and the U.K., even though the latter two countries have more generous policies for redistributing income to low-income households, based on data from the Federal Reserve Bank of St. Louis and Eurostat.
It’s plausible to suggest that Americans should live in smaller homes, that their consumption of media products is bad for their mental health, that American cuisine is less nutritious and delicious than fresh meals enjoyed by French families who go to the store every day, and that European health care systems reduce hardship by more fully covering the sick. The perennial debate over which economic system is better will never end. But one conclusion is clear: America is more successful at creating material abundance and well-being for ordinary people.
Why America outperforms: A high-level explanation
A simple idea from economic growth theory is that if one nation produces higher output per worker than another nation, it must outperform the other nation in one of two ways, or both. It might have a larger capital stock per worker, meaning more and better factories and equipment. Or it might have a higher technology level, so it can produce more output from a given bundle of labor and capital inputs. Nations build their capital stock over time by saving and investing. They realize technological progress by raising the know-how of their workers through education and training, imitating other countries’ more advanced technologies, and achieving homegrown innovation.
Economic growth theory predicts that if nation A produces less GDP per worker than nation B today but has sufficiently good institutions – like effective schools and legal systems – nation A’s output per worker will catch up with B’s level over time. This is because A, seeing more benefit from additional capital stock than B, will invest more until its capital stock per worker catches up with B’s. Also, nation A will converge to B’s technology level through education and imitation.
How do these predictions fit the actual experience of the United States and other advanced nations? The United States had modestly higher GDP per worker than European peer nations in the early 20th century but expanded its lead dramatically during World War II because the war destroyed so much of the capital stock of European as well as East Asian countries, as Harvard University economist Robert E. Lucas, Jr. documented in The 4% Solution: Unleashing the Economic Growth America Needs and economists Marianne Ward and John Deveraux explored further in a 2003 paper on Britain’s relative decline.
As economic growth theory predicts, however, peer nations like Germany, France, and Japan played catchup very successfully during the first five decades after the war. On average, our 10 peer countries reached levels of GDP per worker just over 80% of America’s level by the 1980s. (See Figure 1 below.) GDP per hour worked reached 90% of the U.S. level, as hours per worker declined in most of these countries relative to the United States.
But then, in the 1990s, the peer nations stopped catching up. In the 2010s and 2020s, they’ve fallen back somewhat.
Capital stock per worker in our 10 peer nations caught up with the U.S. level by the 2000s, on average, based on authoritative data from the Penn World Table and the OECD. Peer nations actually pulled ahead of the United States on this measure over the past decade, probably because their economies are more capital intensive than America’s more technology and data-intensive economy.
Figure 1
Catch-up of peer nations stops in the 1990s
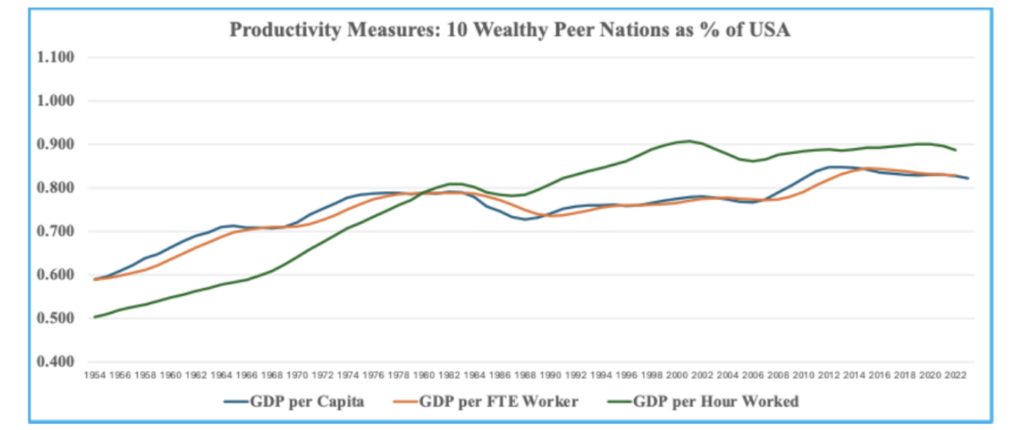
Source: Author’s calculations based on data from the Penn World Table.
Peer countries also nearly reached America’s technology level by the late 1990s as measured by total factor productivity – the output economies produce from a given bundle of inputs – according to OECD and Penn World Table data. One reason is that these nations caught up to U.S educational attainment levels for younger workers. Firms in these countries also proved successful at imitating U.S. technologies and in some industries surpassing them, especially in technology leaders like Japan and Germany.
Around the turn of the century, however, America began to pull away from its wealthy peers as a technological superpower. The U.S. economy increased its lead in total factor productivity by almost 20% from 2000 to 2024, Penn World Table data show. (See Figure 2.)
The U.S. economy has far outperformed peer nations in achieving homegrown innovation at nationwide scale. This success demonstrates a vital point: Economic models that function well for helping relatively backward countries catch up with more advanced economies aren’t necessarily well suited to driving innovation once a country reaches the technological frontier. America has pulled ahead because it has had the world’s best model for innovating and growing when a country is already among the most technologically advanced economies.
The U.S. model of innovation and growth has outperformed others by investing more in research and development, producing more good ideas from each R&D dollar, offering better incentives for private-sector innovation and entrepreneurship, and creating more standout firms with breakthrough products.
Figure 2
America pulls away from its peers
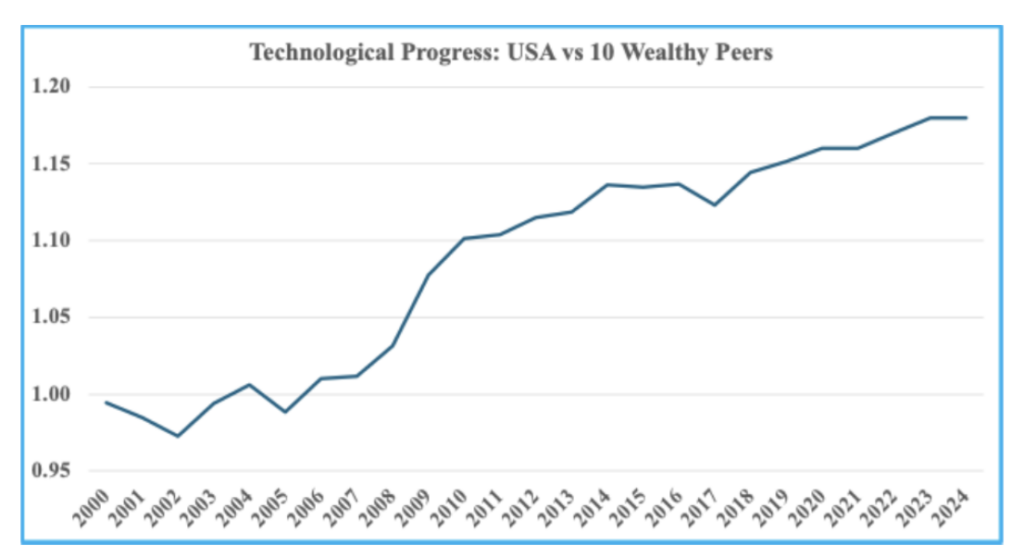
Source: Author’s calculations based on data from the Penn World Table and the OECD.
Innovation takes place with long lags from initial breakthrough ideas to maximum commercial impact, the historical record shows. From electricity in the late 19th century to the genomic revolution in the late 20th, lags of three to four decades have been typical, as Philippe Aghion, Celine Antonin, and Simon Brunel show in their 2021 book, The Power of Creative Destruction: Economic Upheaval and the Wealth of Nations. It also takes 20 years or more for cutting-edge technologies to diffuse from an innovator country to other economies.
Long lags from idea to maximum impact mean that it was the U.S. model’s edge in the mid to late 20th century that accounts for America’s top-of-the-pack technological progress since 2000.
Effective nation-scale innovation, moreover, requires policymakers to have relatively high tolerance for creative destruction, as the early 20th century economist Joseph Schumpeter called it. This is because breakthrough innovations virtually always threaten the interests of incumbent firms and industries, which typically call for regulations to block disruptive upstart companies.
America has avoided such regulations to a greater degree than any peer nation, as Philippe Aghion, Céline Antonin, and Simon Brunel wrote in their 2021 book, The Power of Creative Destruction: Economic Upheaval and the Wealth of Nations.
America has dominated almost all newly emerging industries over the last 80 years, including television and mass-produced housing in the 1940s, semiconductors and computing in the 1960s and 1970s, biotechnology and the internet since the 1990s, and artificial intelligence today. When firms in other countries have surpassed their American competitors, it’s mostly been in older industries, such as steel in the 1970s, autos in the 1980s, and commodity memory chips in the 21st century.
This analysis raises the question: If America’s growth model has demonstrated its superiority time and again over eight decades, why haven’t other advanced nations more fully imitated it? The answer is that they have, but only partially and belatedly. China, meanwhile, is operating what is arguably the world’s most successful model for playing catch-up for a country that is far behind the most advanced economies.
Building the U.S. model was difficult, controversial, and far from inevitable. And this is why the story of five pivotal decisions made by visionary American leaders in the aftermath of World War II remains so relevant today.
No ordinary time
The period from 1944 to 1949 was anything but ordinary, to borrow the title of Doris Kearns Goodwin’s classic book on the home front during World War II. While the war was underway, President Franklin D. Roosevelt mostly decided to defer monumentally important decisions regarding the postwar world until victory was complete. When FDR died suddenly on April 12, 1945, virtually every major issue remained unresolved.
But when America emerged from the war, conditions were extraordinarily favorable for bold decisions. Many of the nation’s leaders felt a strong sense of responsibility toward America’s 15 million-plus veterans in view of their wartime sacrifices. Books like Joseph Goulden’s The Best Years, moreover, point to a striking tone of optimism throughout much of American society on the country’s long-range future in those years, in contrast to pervasive pessimism in Europe and Japan. But if the times presented unusual openness to transformational bets on a bright future, widespread worries that demobilization would cause near-term unemployment created a climate of urgency for policies that would move the nation’s civilian economy into high gear.
A final factor was policymakers’ reevaluation of the threat posed by the Soviet Union and U.S. decisions between 1946 and 1950 to engage fully in the Cold War. National security considerations helped tilt the balance away from caution and toward all the bold decisions we describe in this series.
Together, these decisions helped make America’s economy what it is today. America was far from perfect in the early postwar decades – above all, in the racial injustice and other discriminatory policies of that time – but it succeeded far better than any country ever has at building a model for innovation, growth, and widely shared prosperity.
Just as America’s growth model of the mid to late 20th century accounts for U.S. outperformance in the 21st century, decisions Americans make today will have lasting effects on the nation’s economic health decades from now. For this reason, let’s start by understanding how we got here.