
Advancing in the Face of Headwinds
How America’s Innovation Districts are Promoting Prosperity and Opportunity

1
EXECUTIVE SUMMARY
America’s innovation districts are an outstanding success story. Innovation districts – compact urban areas where knowledge-generating institutions and leading-edge companies cluster together to stimulate creativity, collaboration, innovation, and entrepreneurship – play a central role in the nation’s innovation economy. They have contributed significantly to revitalization and growth in many U.S. cities.
The decade from 2013 to 2022 saw a much faster pace of new innovation district launches than in previous decades. Since 2023, however, innovation districts have faced new headwinds in the form of overbuilt office and lab space in the wider economy, higher interest rates, weak venture capital investment in the life science sector, declining federal research funding, and falling high-skilled immigration.
This report presents new data on the performance of America’s urban innovation districts as economic development engines, updating data we reported in a previous analysis based on 2020 data.
- Innovation districts, this report shows, are delivering significant economic benefits for surrounding neighborhoods, measured by population growth, incomes, commuting times, and housing development. These effects have grown more pronounced than the effects we reported based on 2020 data.
- Neighborhoods surrounding innovation districts are also experiencing considerably greater housing price pressures than they saw in the 2010s, our data show. This reflects rapid growth in housing demand coupled with housing production that has generally proven impressive but nonetheless inadequate.
We also summarize results from a new survey we’ve conducted of innovation district leaders. Top-of-mind priorities for current leaders include stepping up the pace of mixed-use development, filling underutilized space, enriching programming for district tenants, building out necessary infrastructure, and adding more restaurants, greenspace, and other quality-of-life amenities, our survey shows.
Federal, state, and local policymakers all have significant roles to play in advancing America’s innovation districts as a key path to strengthening the nation’s innovation economy throughout the country. Policymakers can promote the growth of innovation districts and the launch of new districts through expanded federal research funding, infrastructure investment, supportive land-use and housing policies, and, in some cases, direct financial assistance.
2
INNOVATIVE DISTRICTS
America’s innovation districts are becoming more powerful engines of local economic development than ever. They’re also facing significant growing pains.
Innovation districts have been one of the nation’s most effective economic development strategies during the 2020s, generating large concentrations of knowledge-based jobs and workers nearby and delivering much higher incomes than comparable places elsewhere. At the same time, weakness in the overall office market presents a near-term headwind for innovation districts and possibly a longer-term problem in certain overbuilt cities. Housing shortfalls are also rapidly emerging as a top challenge for districts and, in some cases, a significant obstacle to further growth.
This report summarizes how U.S. innovation districts are evolving and reshaping local economies in the 2020s. It builds on a previous George W. Bush Institute-SMU Economic Growth Initiative report, which included a first-of-its-kind dataset on the performance of America’s innovation districts. In this report, we update our dataset, incorporating additional districts and four more years of data covering 2021 through 2024. We also report results from a 2026 survey we conducted, with responses from 20 of the 42 districts in our dataset.
Innovation districts are dense, physically compact urban areas where knowledge-generating institutions and leading-edge companies of diverse size and industry, including startups and supportive organizations like accelerators, cluster together to stimulate creativity, collaboration, innovation, and entrepreneurship. In most cases, innovation district leaders aspire to create attractive, walkable environments, including substantial housing options. Successful innovation districts generally involve close cooperation among a variety of players: one or more research universities or academic medical centers, specialized real estate developers, entrepreneurs, investors, incubators, established companies, philanthropists, nonprofits, and local (and sometimes state) governments.
We make no distinction in this report between innovation districts, research parks, and science parks, as all these initiatives exist on a continuum – from the most compact urban districts to the most dispersed suburban parks – and generally share the same purposes.
Innovation districts, to be clear, should not be confused with data centers, even though they sometimes include small data centers within their boundaries. Innovation districts consist primarily of office and lab space for people working there, while data centers mostly consist of warehouse-like buildings filled with computer equipment and relatively few employees. Data centers have become a very controversial topic in the United States over the last year, while innovation districts generally generate little to no local resistance.
There are more than 250 innovation districts and related entities like research and science parks in the world today, up from two or three dozen before 2000. American cities host more than 125 – and considerably more if one loosens the definition. We highlight about 70 districts in this report, with 42 of them included in our new dataset. (See Table 1.)
Eighteen of the districts we reference in the report came into being before 2000. Another 16 were established between 2000 and 2012. The subsequent decade from 2013 to 2022 saw a sharp acceleration in innovation district launches, including 24 of the districts we mention here and numerous others. More districts have come into being since 2023, but there’s been a slowdown in new developments, for reasons we will discuss shortly.
The 42 innovation districts in our dataset, which include almost all of America’s largest districts and parks, contain about 100 million square feet of office and lab space, accounting for between 1% and 2% of all commercial office and lab real estate in the United States. Over 500,000 people work in these districts today. These numbers continue to grow in the mid-2020s, even as the broader office real estate sector suffers from high and rising vacancies and modest new development.
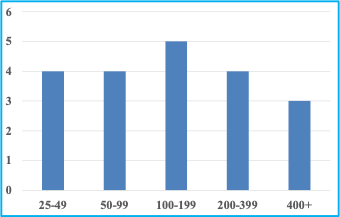
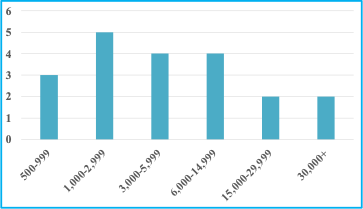
The innovation districts we highlight in our dataset are in most cases large operations. They generally have more than 10 and in some cases 100-plus buildings, several dozen to several hundred tenant organizations, and anywhere between 1,000 and 60,000 people working there. (See Figures 1, 2, and 3 below.)
3
WHY INNOVATION DISTRICTS
The economic rationale for innovation districts is the premise that agglomeration economies – the productivity and innovation benefits arising from talented people and cutting-edge firms working in proximity to one another – function best when innovators are very close together. The benefits of clustering research and development labs are most powerful when they’re within a quarter mile of each other, a 2012 Federal Reserve Bank of Philadelphia study found. And successful product development tends to occur in places even more geographically concentrated than the underlying research on which it’s based, Stanford’s Nicholas Bloom and colleagues showed in a 2023 paper.
Innovation also occurs best in an environment with firms of differing sizes interacting with each other in locations close to research universities, studies show. An additional rationale is that many people clearly like working in innovation districts, so they help innovative firms as well as research universities and academic medical centers – often called eds and meds institutions – attract talent.
Cities and eds and meds institutions create or participate in innovation districts for two reasons: (1) to build great urban places that will help attract and retain knowledge workers and students and promote local economic development, and (2) to accelerate innovation. Private sector firms locate R&D operations in innovation districts for these reasons, too – and to recruit talented students from adjacent universities.
City and state governments support the development of local innovation districts because having a significant concentration of business R&D activities is an economic “game changer” for cities, in the words of Doug Edgerton of the North Carolina Biotechnology Center. North Carolina’s Research Triangle Park (RTP), started in 1960 between Raleigh and Durham, has played a pivotal role in the emergence of the region as one of America’s most innovative, fast-growing places.
Cities also benefit from the tax base associated with thriving innovation districts, particularly in places where tax-exempt eds and meds real estate takes up substantial local land.
Table 1
Innovation districts in our dataset
| District | Metro Area | Year Founded |
District | Metro Area | Year Founded |
|---|---|---|---|---|---|
| Rensselaer Technology Park | Albany, NY | 1981 | Purdue Discovery Park District | Lafayette, IN | 2001 |
| Sandia Science & Technology Park | Albuquerque, NM | 1998 | KU Innovation Park | Lawrence, KS | 2009 |
| Atlanta Tech Square | Atlanta, GA | 2000 | Coldstream Research Campus | Lexington, KY | 1992 |
| Auburn Research & Technology Foundation | Auburn, AL | 2004 | Nebraska Innovation Campus | Lincoln, NE | 2014 |
| Capital City Innovation | Austin, TX | 2017 | Innovation Hub at Research Park | Lubbock, TX | 2014 |
| BioPark | Baltimore, MD | 2003 | University Research Park, Univ of Wisc-Madison | Madison, WI | 1984 |
| LSU Innovation Park | Baton Rouge, LA | 1988 | Towerside Innovation District | Minneapolis, MN | 2013 |
| Virginia Tech Corporate Research Center | Blacksburg, VA | 1985 | uCity Square | Philadelphia, PA | 1997 |
| Kendall Square | Boston, MA | 1960 | Arizona State University Research Park | Phoenix, AZ | 1984 |
| Longwood Medical Area | Boston, MA | 1972 | Phoenix Bioscience Core | Phoenix, AZ | 2017 |
| Buffalo Niagara Medical Campus | Buffalo-Niagara, NY | 2002 | Pittsburgh Innovation District | Pittsburgh, PA | 2000 |
| Research Park (Champaign) | Champaign-Urbana, IL | 1999 | 195 District | Providence, RI | 2011 |
| University Tech Park at IIT (Chicago) | Chicago, IL | 2006 | Centennial Campus, North Carolina State Univ | Raleigh, NC | 1984 |
| Cincinnati Innovation District | Cincinnati, OH | 2020 | Research Triangle Park | Raleigh, NC | 1960 |
| Cleveland Health-Tech Corridor | Cleveland, OH | 2010 | University of Utah Research Park | Salt Lake City, UT | 1968 |
| Pegasus Park | Dallas, TX | 2015 | South Lake Union | Seattle, WA | 1990 |
| Fitzsimons Innovation Community | Denver, CO | 2004 | Cortex Innovation District | St. Louis, MO | 2002 |
| Gainesville Innovation District | Gainesville, FL | 2010 | St. Pete Innovation District | Tampa-St. Petersburg, FL | 2016 |
| Ion District | Houston, TX | 2021 | Tech Parks Arizona | Tucson, AZ | 1994 |
| University of Houston Technology Bridge | Houston, TX | 1953 | Discovery District (College Park) | Washington, DC | 2017 |
| 16 Tech | Indianapolis, IN | 2015 | Innovation Quarter | Winston-Salem, NC | 2002 |
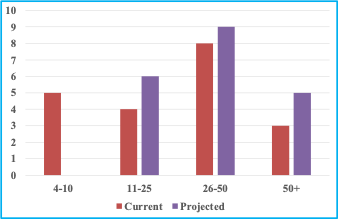
Figure 1
Current and projected size of innovation districts
(Number of buildings in the 20 districts responding to our survey)
Source: George W. Bush Institute survey of 20 innovation districts (April-July 2026)
Figure 2
Number of tenant organizations in the district
(Distribution of the 20 districts responding to our survey)
Source: George W. Bush Institute survey of 20 innovation districts (April-July 2026)
Figure 3
Number of people working in the district
(Distribution of the 20 districts responding to our survey)
Source: George W. Bush Institute survey of 20 innovation districts (April-July 2026)
a. EVOLUTION OF AN IDEA
Ideas on what an innovation district should aim to be have evolved rapidly, even as the number of innovation districts has soared. Figure 4 presents a schematic of this evolution: Each blue rectangle represents a stage in state-of-the-art thinking about innovation districts, and each green circle represents forces that caused this thinking to shift to a new stage.
Figure 4
Innovation district: Evolution of an idea
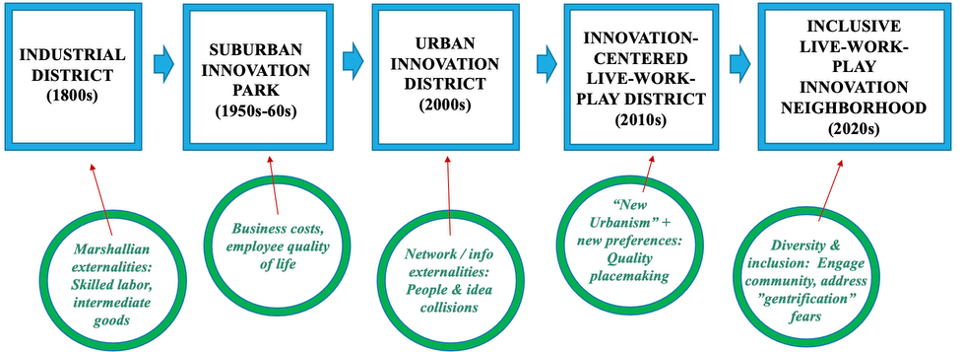
Industrial districts: Nineteenth-century manufacturing operations tended to congregate in close proximity to one another in urban industrial districts like Midtown in Manhattan, New York; Bedford-Stuyvesant in Brooklyn, New York; and Milwaukee Avenue in Chicago, Illinois. This pattern reflected the benefits of locating facilities within walking distance of dense pools of skilled labor and intermediate goods suppliers. Once there was a critical mass of manufacturers in one location, it was in the interest of new entrants to locate there as well.
Suburban innovation parks: Improved transportation made it possible for firms to move manufacturing and R&D operations to suburban locations, including research/science parks, starting in the 1950s. Many took advantage of this opportunity to reduce costs and give employees higher quality of life in less crowded conditions. RTP, an emblematic suburban research park, rose to prominence due to the opening of an IBM R&D facility in 1965 and the relocation of British pharmaceutical giant Glaxo’s U.S. headquarters in 1983.
Urban innovation districts: Leading-edge firms increasingly started to favor locating R&D facilities in dense urban locations near research universities, rather than suburban office parks, in the 2000s. Their chief goal was to maximize the benefits of proximity, including collisions with talented researchers at eds and meds institutions and other firms.
California’s Silicon Valley pulled far ahead of Massachusetts’ suburban Route 128 as a tech hub in the 1980s and 1990s in part because of its greater density and social connectedness, according to economist AnnaLee Saxenian. But then urban Kendall Square in Cambridge, MA started to outshine Silicon Valley in biotechnology starting in the 2010s due to still greater density. RTP is now building an urban hub in the heart of its sprawling suburban property.
Innovation-centered live-work-play districts: Innovation districts shifted toward incorporating residential and recreational elements in the 2010s, driven by growing enthusiasm for quality urban placemaking. This change also reflected recognition that the economic benefits of agglomeration work best in places with heavy mixing of land uses. The 20th-century practice of separating office real estate from other activities was a key reason most American downtowns declined between 1950 and 2000.
Kendall Square saw virtually no housing development between 1960 and 2018 and had an infamously limited restaurant scene as recently as the late 2010s. Most people working in the square got there each day via long commutes on the frequently unreliable Massachusetts Bay Transportation Authority Red Line. In RTP, land-use rules entirely prohibited residential development, despite vast available land. In these and other places, innovation district leaders changed course in the 2010s. Virtually all innovation districts launched since 2010 have incorporated “live” and “play” elements in their plans from inception.
Inclusive live-work-play innovation neighborhoods: The 2020s have seen rising concerns that successful innovation districts might stimulate explosive increases in land and housing prices in nearby neighborhoods and lead to displacement of low- to moderate-income people living there. Many district leaders now pay much closer attention than in the past to building districts in ways that will benefit people in surrounding neighborhoods and mitigate displacement.
4
UPDATE ON AMERICA’S INNOVATION DISTRICTS
a. RISING EXTERNAL HEADWINDS
Economywide market conditions, which were extraordinarily supportive of innovation district development between 2012 and 2021, turned into significant headwinds starting in 2022.
Real estate markets, interest rates, and venture capital funding: The overall U.S. office real estate sector has suffered a steep slowdown, starting with the expansion of remote work during the COVID-19 pandemic beginning in 2020. Office market weakness has grown more severe as a result of interest rate increases since mid-2022 and emerging evidence that employers believe they will be able to replace some white-collar workers with artificial intelligence. Traditional urban downtowns have seen particularly sharp increases in vacancy rates. Most large downtowns currently have vacancy rates above 20%, with some even above 30%, based on Moody’s data.
Total office real estate under construction has fallen more than 80% since its 2020 peak, according to CBRE.
Dedicated life science real estate, combining office with wet labs, held up better than other categories of office property in 2020 and 2021 since life science R&D generally requires in-person work with specialized equipment. Life science space features prominently in innovation districts, accounting for about half of the 100 million square feet of office and lab space in our dataset’s 42 districts. Some 20% to 25% of all dedicated U.S. life science office and lab real estate is in innovation districts, we estimate based on industry data. Life science space came to absorb a larger-than-ever share of innovation district real estate in the early 2020s as firms in information technology (IT) and other non-healthcare-focused industries embraced remote work.
But overbuilding plus a contraction in venture capital funding for biotechnology companies brought a substantial slowdown to the life science submarket starting in 2022.
New supply of life science space in the United States accelerated between 2022 and 2024, both inside and outside innovation districts, according to Colliers data. Between 2016 and 2020, developers added about 3 million to 4.5 million square feet of dedicated office and lab space each year, only slightly ahead of net absorption – that is, overall new tenant occupancy less departures. New supply grew to 6 million square feet in 2021, but net absorption was even higher, leading to a brief period of extremely tight market conditions. (See Figure 5.)
These favorable dynamics started to reverse in 2022. New supply amounted to 10 million square feet in that year, 13 million square feet in 2023, and 14 million square feet in 2024. Net absorption, on the other hand, fell to 5.5 million square feet in 2022 and 1 million square feet in 2023. It turned slightly negative in 2024 as tenants gave up more space than they took on. New supply fell back in 2025 but still amounted to a robust 8 million square feet, while net absorption remained modestly negative.
One major reason for declining absorption was a significant decline in venture capital investment into biotechnology companies from the record-high pace of 2020 to 2022. Venture capital flows into biotech fell off by about a quarter in 2023, reflecting high interest rates after 2022 and a collapse in initial public stock offerings by biotech companies. Total employment in the U.S. biotech industry, which had expanded more than 50% from 2015 to 2022, declined slightly over the next three years.
Figure 5
U.S. life science office & lab space:
Supply, absorption, & vacancy rates
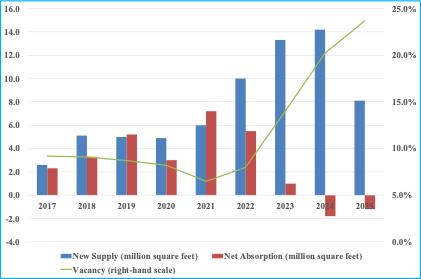
This over-investment led to high and rising vacancy rates in dedicated life science properties. Overall vacancy rates in the industry rose to 24% in early 2026 from about 6% in 2021. It continues to increase, the Colliers report shows. About 9 million square feet of additional space is in the development pipeline, based on early 2026 data. Industry employment has started growing again, and net absorption seems to have bottomed out, but vacancies are likely to increase further over the next year unless absorption accelerates.
Market conditions for life science real estate have varied tremendously across metropolitan areas in the 2020s, recent reports from Colliers and other real estate firms show.
- The Raleigh-Durham area has seen rapid supply growth in both RTP and outlying suburban areas, but also robust net absorption and thus below-average and falling vacancy rates.
- The New York City market is also experiencing strong net absorption and stable vacancy.
- The Philadelphia market has recently seen both strong supply growth and absorption in uCity Square and the emerging Navy Yard district, but continues to have above-average and rising vacancy rates.
- West Coast markets in San Francisco and San Diego, California, and Seattle, Washington, feature high vacancy rates and very low net absorption, but also extremely little supply growth.
- Boston-Cambridge is both the country’s largest and its most troubled life science real estate market, with 34% vacancy, new supply continuing to flood the market in Kendall Square and other areas, and rising numbers of unemployed recent science graduates.
- Among smaller life science markets, Atlanta, Dallas, Houston, Pittsburgh, Salt Lake City, and Louis – each home to one or more prominent innovation districts featured in this report – are still experiencing demand growth, albeit from a relatively small base.
Innovation district properties have held up better than overall life science real estate, but they haven’t been immune. In addition to slow hiring and absorption by biotech firms, many areas of IT have seen employment declines associated with overhiring between 2020 and 2022, and rising reliance on AI. A lot more IT work is being done in large data centers and a little less in human-centered innovation districts.
Apple, for instance, has repeatedly delayed building a new campus on land it acquired in RTP in 2018. Technology firms have announced layoffs of about 150,000 workers since the start of 2026, reducing demand for space in both innovation districts and traditional downtown locations.
Innovation districts and research parks reported vacancy of about 9% in a 2025 Association of University Research Parks/Stiletto survey. Buildings in Kendall Square, RTP, and Seattle’s South Lake Union district have recently changed hands at prices some 20% to 30% below peak values. It’s likely that vacancies have risen above 10% in 2026 in view of the ongoing expansion of available space and continuing headwinds facing both the biotech and IT sectors.
Another real estate report by Jones Lange LaSalle found that office vacancy rates in the wider submarkets in which 18 university-anchored districts are located rose to 20% in late 2025, from about 8% in 2019. Still, vacancy rates in these submarkets were 3 percentage points lower than in their overall surrounding metropolitan areas, on average, despite 25% higher rents.
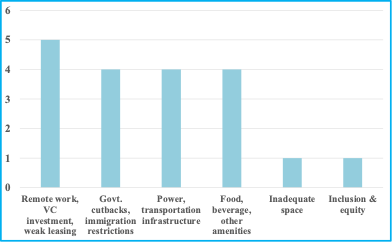
About a quarter of the 20 districts responding to our survey cited remote work, low venture capital investment, weak leasing activity, or excess office space in their local market as top-of-mind challenges they’re currently facing. (See Figure 6)
Figure 6
Top-of-mind challenges
(Mentions by the 20 districts responding to our survey)
Note: We allowed respondents to list as many challenges as well as opportunities as they wanted in their own words. Source: George W. Bush Institute survey of 20 innovation districts (April-July 2026)
Federal research investment and immigration policy: Reductions in federal research spending have also held back demand for innovation district office and lab space since early 2025. Life science R&D spending by the National Institutes for Health (NIH) rose to $48.7 billion in 2024, from $34.1 billion in 2017, providing a strong tailwind for research universities and supporting the development of life science-focused innovation districts. But NIH spending has declined slightly in inflation-adjusted terms since the start of the second Trump Administration in January 2025. Spending by the National Science Foundation (NSF) likewise grew to $9.9 billion in 2023, from $7.5 billion in 2017, but has since fallen modestly.
The administration has proposed sweeping cuts to both NIH and NSF spending in future years, which has likely chilled investment activity by research universities, even though Congress has not so far indicated a willingness to endorse these proposals.
In addition, the Trump Administration’s crackdown on immigration resulted in a 17% decline in college and graduate school enrollment by new international students for 2025-2026, according to the advocacy organization NAFSA. Falling international enrollment has likely contributed to slowing innovation district development both by weakening university cash flows and by reducing the number of foreign-born researchers for whom universities need to find lab space – especially at universities with relatively high proportions of international students.
About one in five districts responding to our survey cited government research funding cutbacks or new immigration restrictions as top-level current challenges.
State and local support: Slower spending growth by state and local governments in 2026 after several years of significant budget increases will likely result in smaller support for initiatives to expand existing innovation districts or build new ones. State and local general fund spending grew more than 6% in each year between 2021 and 2025, supported by more than $750 billion in extraordinary federal aid under Congress’s COVID-era spending packages, according to data from the National Governors Association (NGA) and associated organizations. In inflation-adjusted terms, state and local spending rose almost 10% from 2019 to 2024.
Unusually rapid spending growth provided another tailwind to the development of innovation districts. Local governments have played essential roles in building almost all successful innovation districts. Eighteen of the 20 districts responding to our survey indicated they have received some form of state and local government assistance. The most common has been favorable tax treatment, followed by construction of vital infrastructure, leasing of space in the district by government entities, direct funding of construction or operations, and marketing efforts on behalf of the district.
But state and local government spending is slowing sharply. Total state spending will rise only 1.3% in 2026, according to NGA data. This amounts to a significant cut in inflation-adjusted terms, since inflation rates are running at about 3%. Fully 23 states project absolute spending declines in inflation-adjusted terms. Looking further ahead, states will experience additional budgetary pressure from Medicaid cuts included in the 2025 One Big Beautiful Bill tax law.
While there aren’t comprehensive projections for 2026 local government spending, it’s clear that local governments are also seeing budgetary pressure from the end of extraordinary COVID-era federal support and rising costs associated with policing and employee pension plans.
b. INNOVATION DISTRICT INITIATIVES
Despite these challenges, innovation district leaders are continuing to expand and to plan for future long-term growth.
Physical space: More than 80% of parks and districts participating in the 2025 Association of University Research Parks/Stiletto survey reported that they are actively planning or building additional space. Planned construction would represent an additional 99 million square feet by 2035, almost doubling the collective real estate footprint of the parks and districts participating in the survey.
In our own survey, we asked district leaders how many buildings they currently have and how many they plan to add, in both cases requesting that they classify their present and projected physical plant into one of several size bins. Ten of our 20 respondents indicated that they plan on growing sufficiently to place their district at least one bin higher than it’s in today. This means, roughly speaking, that half intend to at least double their space in coming years. (See Figure 1.)
Based on our conversations with innovation district leaders, most developers and institutions planning physical expansion are relatively confident concerning demand for space within their districts, despite the challenges facing the wider office sector.
Physical expansion is a complex undertaking. Innovation districts must ensure, first of all, that their workspaces meet the needs of leading-edge companies as well as academic tenants. Prospective tenants have come to expect amenity-rich Class A office space. Labs and clean rooms add considerably to construction costs. Startups and academic users want large makerspaces.
Successful innovation districts are working to meet demand:
- Dallas’s Pegasus Park opened its new 135,000 square foot life science-focused Bridge Labs facility in 2024.
- The Winston-Salem Innovation Quarter, blessed with greenspace into which it can grow, is planning an additional 2 million square feet to house the new Piedmont Triad Regenerative Medicine Engine, associated with Wake Forest School of Medicine, along with private-sector tenants.
- The Brooklyn Navy Yard district in New York launched an initiative to build a new biotech innovation hub, with $20 million from the New York city government, in 2023.
- Louis’s Cortex Innovation District broke ground in 2025 on a new 600,000-square-foot neuroscience facility for Washington University as well as multiple corporate R&D and manufacturing facilities. The new Advanced Manufacturing Innovation Center St. Louis, funded by grants from Boeing plus the Missouri and St. Louis governments, will open nearby in 2027.
- The 16 Tech district in Indianapolis broke ground in 2025 on a new lab building anchored by Indiana University.
- Houston’s Texas Medical Center is working on plans that will add 5 million square feet of office and lab space to its Helix Park, roughly doubling the district’s footprint. Rice University’s Ion District, meanwhile, is developing The Arc, a new 200,000-square-foot multi-use innovation building adjacent to its original facility.
- Arizona State is building five science and technology centers in its multiple innovation districts, specifically aiming to expand collaboration between ASU researchers, private sector firms, and the new Mayo Clinic academic medical center in north Phoenix.
- Tech Square stakeholders – including Georgia Tech and Emory University – are collaborating to build a 2,000-acre companion innovation area, Rowen, in suburban Gwinnett County outside Atlanta, which can more affordably house land-intensive activities like biomanufacturing.
Creating and preserving space for startups, an essential element in innovation district ecosystems, is a particular challenge. Most startups can’t afford to pay the premium rents required to make the economics work for well equipped, amenity-rich office and lab buildings. Deep-pocketed large companies further drive up rents, squeezing startups out. One prominent Kendall Square venture capital firm moved to less expensive space in Boston because its portfolio companies can’t afford space in the square.
Preserving startup space in growing innovation districts generally requires subsidies from university, government, or philanthropic sources – or from a tax on full-pay tenants.
Some districts are continuing to add new dedicated space for startup firms. The Winston-Salem Innovation Quarter recently opened Sparq Labs, a low-cost space for early-stage biotech companies.
Districts must also be accessible, a significant challenge in some urban environments like Cambridge, Philadelphia, and New York City. Kendall Square, in the heart of bustling Cambridge, is confronting what local business leaders call a “transportation crisis” that threatens a “breaking point” for the district’s growth. Several districts are working to address critical physical infrastructure issues like roads, parking, and transit access.
Others are focused on addressing electric power issues, which are rapidly growing more complex as a result of data center operations within their facilities. A fifth of the districts that responded to our survey cited infrastructure shortcomings as top-level challenges.
Curation and programming: Successful innovation districts generally seek to curate the kinds of tenants the district hosts and to develop programming and shared systems that amplify the benefits of being there. Goals include attracting researchers and companies from a range of fields to promote interdisciplinary convergence of ideas, having firms of all sizes, providing support for startups, promoting heavy mixing of activities and space uses, and fostering connection and collaboration.
Here are some of the strategies:
- Value-added coworking spaces: Successful districts create diverse spaces that allow tenants to stay in the district as they grow and needs change. Rice’s Ion district offers gradations from coworking spaces to areas with dedicated private offices alongside shared assets to private suites and whole floors. Some districts host life science-focused coworking space with shared lab equipment and services, reducing fixed costs for startups.
- Cambridge-based BioLabs, which operates coworking spaces in more than a dozen metro areas, has facilities in RTP; Dallas’s Pegasus Park; Princeton, New Jersey’s Princeton Innovation Center; and other innovation districts. BioLabs will open its newest facility in Rochester, Minnesota’s Discovery Square district, adjacent to the Mayo Clinic’s main campus, late this year.
- The Cambridge Innovation Center (CIC), founded in 1999 in an MIT-owned building in Kendall Square, now houses more than 1,000 startups in buildings across multiple Boston-area innovation districts. CIC has played a pivotal role in the emergence of Kendall Square as one of the world’s premiere innovation districts, many experts confirm.
- Programming: Many innovation districts host startup activities like the MassChallenge competition and accelerator program, which operates in innovation districts in the Boston, Austin, Dallas, and Houston metros and elsewhere. Atlanta Tech Square and Cortex offer frequent networking and speaker events for members. At RTP, the state-funded North Carolina Biotechnology Center and the nonprofit Council for Entrepreneurial Development have long offered entrepreneurship programming and networking opportunities.The Triangle Universities Center for Advanced Studies, Inc. (TUCASI), a “park within the park” that local leaders call “the secret sauce” of RTP, operates a rich variety of programming centered on the Park’s three founding universities: The University of North Carolina at Chapel Hill, North Carolina State, and Duke University.
Figure 7
Top-of-mind opportunities
(Mentions by the 20 districts responding to our survey)
Note: We allowed respondents to list as many challenges as well as opportunities as they wanted in their own words. Source: George W. Bush Institute survey of 20 innovation districts (April-July 2026)
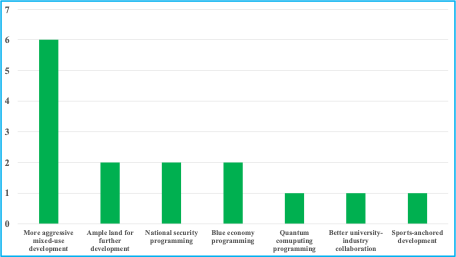
- New substantive themes: Some innovation districts are developing programming around high-profile economic themes. The reshoring of manufacturing, defense technologies, and air mobility figure prominently in the programming of emerging districts in Dayton, Ohio; Newark, New Jersey; and Syracuse, New York. Florida’s Pete Innovation District is building local expertise in the ocean-focused “blue” economy. Districts participating in our survey also pointed to growing emphasis on quantum computing and national security. (See Figure 7.)
- Talent development: More and more districts are launching workforce development initiatives to support the needs of local employers and expand opportunity for residents. The University of Pennsylvania and Drexel University have operated successful workforce development programs in association with uCity Square for more than 30 years. Both the Cortex Innovation District and the University of San Antonio’s new downtown innovation hub have launched workforce programs focused on cybersecurity. The Brooklyn Navy Yard , the Cincinnati Innovation District, and the Cleveland Health-Tech Corridor operate significant skills programs as well.
- Heavy eds and meds engagement in local innovation ecosystems: A growing number of eds and meds institutions are stepping up their focus on local startups and economic development, often centered in nearby innovation districts and shifting away from licensing technologies to faraway firms that contribute nothing to the local economy.
These activities are core elements attracting companies to innovation districts, which is why districts that are little more than real estate plays don’t work. Successful innovation districts typically have a management entity separate from participating academic institutions or developers that coordinates the district’s curation and programming activities.
Design and quality of life: Fulfilling the many goals of an innovation district requires careful design and substantial investment in quality-of-life amenities. Some districts are working to establish an authentic sense of place through adaptive reuse of historic buildings. Many are creating spaces intentionally designed to promote learning and innovation, with dedicated areas for group ideation, individual focus time, social mingling, and quiet “brain breaks,” reflecting ideas the architecture firm HKS describes in a recent report.
In addition, successful districts typically include design elements to promote social interaction among people from different organizations, like well-located “hot spots,” as well as transparent building “skins” to showcase innovative work. They also often include public art to energize their gathering places, as Greg Wright of Spark Towns has highlighted.
As the innovation district concept has evolved to incorporate “live” and “play” elements, district leaders are increasingly focused on issues like affordable childcare and after-hours entertainment. Four of the 20 districts responding to our survey pointed to inadequate restaurant, bar, coffee shop, and greenspace offerings as significant challenges they’re working to address.
Districts are pursuing a range of initiatives:
- The Winston-Salem Innovation Quarter and Seattle’s South Lake Union have seen significant adaptive reuse of historic industrial buildings and large investment in nearby amenities. The Innovation Quarter is heavily engaged in programming the outdoor space in adjacent Bailey Park.
- Atlanta Tech Square and the Pittsburgh Innovation District are investing in restaurant offerings, public event spaces, and “parklets.”
- The Pete Innovation District published a new master plan in 2025, with a focus on “smart multimodal mobility” including water taxis as well as improved greenspace and public art.
- Kendall Square has recently added greenspace designed by architect Maya Lin, restaurant locations, street-level improvements, and a long-awaited pharmacy.
- Oklahoma City is investing in walkability and nearby quality of life in its medical center-focused innovation district.
- RTP is building substantial walkable greenspace and food and beverage amenities into its Hub RTP development in heart of the park.
Governance: Successful innovation districts recognize that effective collaboration and organization among district stakeholders are essential. Stakeholders typically include disparate institutions with different goals and decision-making styles and little record of working closely with one another, as Julie Wagner points out in a 2023 Global Institute on Innovation Districts report. “Without some way of governing, separate ideas and strategies will fail to ‘add up,’” she argues.
Participating eds and meds institutions and other stakeholders generally need to develop a shared vision for the district addressing issues such as the following:
- Building a master plan for physical development of the district.
- Working out goals and practices for the district’s programming and curation.
- Determining allowed physical spaces and activities for district stakeholders.
- Constructing shared research agreements among institutions.
- Marketing the district.
- Resolving disputes.
Stakeholders, moreover, need to build governance processes to sustain collaboration as conditions and plans evolve. The Winston-Salem Innovation Quarter, for instance, had to navigate a significant change in the governance structure of the district’s dominant institution, Wake Forest University Health Sciences, and the departure of key private-sector tenants during the COVID pandemic. Building the innovation district has been “a game of continuous innovation and setbacks, and staying true to [our] principles,” according to Graydon Pleasants, one of the Innovation Quarter’s chief planners.
Another emerging challenge is building collaborative networks with other elements of a district’s regional innovation ecosystem, as the Global Institute on Innovation Districts discusses in a new report.
Most successful innovation districts have a management entity separate from participating institutions and developers to coordinate efforts and address these challenges. Some management entities – including the entities managing RTP, Cortex, uCity Square, the Pittsburgh Innovation District, and the Helix district at Houston’s Texas Medical Center – operate with multistakeholder models. The MaRS Discover District in Toronto has an exceptionally effective multistakeholder governance structure. Other districts, like the Innovation Quarter and the Ion district, have a single dominant institution. But even the latter typically find it helpful to establish management entities that can move more nimbly than their parent institutions.
To be effective, innovation district management entities must have sustainable financing streams. In some cases like RTP, sustainable funding comes from large land ownership in the district. In other cases like uCity Square, stakeholders empower the management entity to levy fees on tenants.
Inclusion: Innovation district initiatives to become more inclusive and expand opportunity in surrounding neighborhoods mostly center on K-12 education, jobs, and inclusive placemaking. They also include affordable housing.
- K-12 initiatives: Drexel and the University of Pennsylvania are helping develop a K-8 STEM-focused school near uCity Square, while Arizona State has helped create a biomedical magnet high school near an innovation district in Phoenix. Cortex stakeholders have established the Collegiate School of Medicine and Bioscience for high school students. Wake Forest has launched popular on-campus summer immersion and paid internship programs for high school students living near the Innovation Quarter.
- Jobs and workforce development: Eds and meds institutions associated with Cortex, uCity Square, and a new innovation district in Columbus, Ohio, operate workforce training programs for neighborhood adults and job platforms to help them find work with district employers. Cleveland Health-Tech Corridor stakeholders established the Evergreen Cooperative Initiative to create living-wage jobs in locally-owned companies serving the area’s hospitals and other enterprises. The Pittsburgh Innovation District has launched a program to increase hiring by constituent organizations in the nearby Oakland.
- Inclusive placemaking: Wake Forest and partner Atrium Health are working alongside a historic Black church to create a “Metropolitan Village” just across a highway from the Innovation Quarter, with affordable housing, workforce development initiatives, and programming to connect neighborhood residents with the Innovation Quarter. The Innovation Quarter’s 2025 Juneteenth celebration for nearby neighborhoods attracted more than 10,000 people.
A handful of universities have engaged in comprehensive placemaking initiatives in underinvested neighborhoods near their innovation districts.
- University of Pennsylvania and Drexel: Penn and a group of community partners launched their West Philadelphia Initiative in Initiative the early 1990s. This has focused on K-12 education, workforce development, job placements, housing rehabilitation, and purchasing by participating institutions from locally-owned vendors. Drexel’s Dornsife Center for Neighborhood Partnerships has also played a leading role in the neighborhood. The West Philadelphia Initiative has helped create over 5,000 jobs and 1,000-plus housing units. It has also catalyzed significant improvements in neighborhood schools, reduced crime, and brought new quality-of-life amenities to the neighborhood.
- Case Western University and the Cleveland Clinic: CWU, the Cleveland Clinic, and community partners launched the Greater University Circle Initiative in 2005. The Initiative has focused on physical redevelopment of neighborhoods in the University Circle area, affordable housing, attracting small businesses, and purchasing by participating institutions. The Initiative has brought several hundred employees of CWU or the Cleveland Clinic to the neighborhood and helped launch numerous locally-owned businesses.
Housing: Building housing in or near innovation district workplaces has become a high priority for district leaders over the last decade. People who live relatively close to significant “activity centers” have much shorter commutes than people who don’t, but fewer than 40% of people in large metro areas live within three miles of a center, according to Brookings Institution research.[i] Shortages of nearby housing are becoming a significant recruitment problem for employers, numerous innovation districts report.
In our survey, developing more mixed-use real estate including housing was by far the most commonly cited “opportunity” of interest to district leaders. (See Figure 7.)
Some innovation districts are planning multifamily residential development in centrally-located district sites, including on university-owned land. Kendall Square has plans to add more than 1,700 units in the heart of the district. RTP will develop 1,200 housing units in its new Hub RTP.
Other districts that have played an active role in developing apartments within or near the district include the following:
- uCity Square (Philadelphia)
- Philadelphia Navy Yard
- 195 District (Providence)
- Winston-Salem Innovation Quarter
- Pete Innovation District
- Cortex Innovation District (St. Louis)
- 16 Tech (Indianapolis)
- Purdue Discovery Park District (West Lafayette, Indiana)
- Michigan State University’s “Medical Mile” development (Grand Rapids, Michigan)
- University Research Park (Madison, Wisconsin)
- Coldstream Research Campus (Lexington, Kentucky)
- Tech Parks Arizona (Tucson)
We’ve identified 27 large apartment developments that have opened since 2020 and are within short walking distance of one of the 42 innovation districts in our dataset. Of these 27 apartment complexes, 21 are pure luxury developments, in every case advertised as being within walking distance of workplaces in the innovation district. Developers have set aside income-restricted units in six, located in or near Kendall Square, uCity Square, Cortex, the Cincinnati Innovation District, Minneapolis’s Towerside Innovation District, and Arizona State’s Phoenix Bioscience Core.
c. NEW INNOVATION DISTRICTS
Developers and eds and meds institutions have continued to launch new innovation districts since our 2023 report, including in cities that already host large districts.
Some prominent examples:
- The State of New Jersey is building a New Jersey AI Hub in partnership with Princeton University, Microsoft, and the AI firm CoreWeave.
- George Mason University opened the first building of its planned GMU SciTech Campus within the new Prince William Innovation Park in Manassas, Virginia, in 2025.
- Virginia Tech University has opened a Virginia Tech Innovation Campus in Alexandria, Virginia.
- Longfellow Real Estate Partners is developing Durham Innovation District near Duke’s East Campus and a new district adjacent to UNC Chapel Hill.
- Atrium Health, its Wake Forest School of Medicine affiliate’s new Charlotte campus, and Wexford Science & Technology partnered to launch The Pearl, a new life science-focused innovation district in Charlotte, North Carolina, in 2025.
- In Detroit, Michigan, Ford Motor CEO Bill Ford has opened the new Michigan Central innovation and culture hub in Detroit’s historic art deco train station, while the University of Michigan is building a new Center for Innovation
- Purdue University and partners opened the new One Health Innovation District, anchored by Elanco Animal Health’s new global headquarters, in Indianapolis in 2025.
- Fort Worth, Texas, established a Medical Innovation District that hosts Texas Christian University’s new medical school in its Near Southside area, close to a new innovation-centered campus Texas A&M University is building on the edge of downtown Fort Worth.
- The Woodlands, Texas, launched it new life science-focused The Woodlands Innovation District in partnership with the University of Houston’s local branch north of Houston in 2023.
- The University of Texas at San Antonio opened San Pedro II, a new technology-focused innovation hub, near downtown San Antonio in early 2026. Port San Antonio, meanwhile, broke ground on its new 1,600-acre Tech Port campus on the city’s southwest side.
- Utah Tech University is developing the Utah South Innovation District in St. George, Utah, with an emphasis on desert living, functional genomics, and endurance sports.
- The University of California-Davis and Wexford Science & Technology partnered to open the $1.1 billion mixed-use Aggie Square district, one of the largest districts to be launched over the last decade, near UC-Davis’s Sacramento campus in 2025.
d. RISING COMPETITION FROM CHINA AND OTHER COUNTRIES
Another important innovation district story in the 2020s has been the rapid buildout of massive science parks in East Asia, with strong sponsorship by central governments that view these initiatives as key components of their national industrial policies.
- China has continued to expand four national science parks established under its 2017 Five-Year Plan in Beijing, Shanghai, Hefei, and the Guangdong-Shenzhen-Hongkong Greater Bay area. China’s science parks operate at an entirely different scale than their U.S. competitors. Shanghai’s Zhangjiang Science City reportedly hosts some 18,000 companies, in contrast with the largest American districts, which host several hundred each. Zhangjiang says it will soon have about 900,000 people working within the park – almost twice the total number working in all U.S. innovation districts and research parks. China’s science parks have played central roles in the nation’s growing capabilities in AI, semiconductors, and biopharmaceuticals.
- Both Taiwan and South Korea are building vast corridors focused on semiconductor R&D and supply chains. Taiwan’s Hsinchu Science Park currently hosts about 180,000 workers.
- Singapore’s new Punggol Digital District, focused on AI, robotics, and cybersecurity, plans to host 28,000 jobs, also considerably more than any but the largest U.S. districts.
5
HOW AMERICA’S INNOVATION DISTRICTS ARE PERFORMING
We assess the performance of innovation districts based on two questions. First, are districts creating prosperous, high-opportunity neighborhoods that are attractive to high-skilled people and innovation-focused businesses? Second, is housing supply keeping up with demand in these neighborhoods? Places that experience strong demand growth but not a commensurate supply response tend to see rapid housing price appreciation and potential displacement of low-to-moderate income people living there.
a. PROSPERITY AND INNOVATION
Overall innovation district performance: Innovation districts are succeeding in their economic development goals, based on our data quantifying the performance of neighborhoods surrounding innovation districts.
Tables 2 and 3 show how the 42 innovation districts in our dataset are performing relative to the United States as a whole in creating prosperous neighborhoods nearby. Our approach is to estimate the extent to which innovation districts and surrounding areas are seeing population expansion, above-average incomes and income growth, and growth in highly educated people working in what urbanist Richard Florida calls “creative” sectors – industries that disproportionately employ highly educated people like information technology, healthcare, science, finance, and the arts. Our approach makes several assumptions:
- People vote with their feet: If an area is growing faster than other areas, most likely it is an attractive place to live, with good job opportunities within commuting range.
- Rising educational attainment: If the education level of people living in a neighborhood rises faster than in other places, it’s because people of high attainment levels are moving in. Education levels of individual adults living in a place don’t change quickly.
- Nearby job opportunities: If average commuting times for people in a neighborhood are relatively low and stable, most likely the composition of sectors in which people work reflects the mix of opportunities close by. Low commuting times and high population shares working in “creative” sectors mean there are many creative-sector jobs nearby.
- Above-average income growth can mean two things, both good: Strong income growth can mean that people with high incomes are moving in, or that people already there are realizing faster-than-average income growth. In successful places, both are true.
Our 42 innovation district neighborhoods have significantly outperformed their surrounding counties and metro areas as well as the nation as a whole for population growth, educational attainment, quality jobs, incomes, and commuting times:
- Population in our 42 innovation district neighborhoods grew 52% from 2010 to 2024, on average. (See Table 2.) This compares with 10% growth for the United States as a whole, 16% for the 38 corresponding metro areas, and 12% for the 40 counties where these districts are located. Just under 2 million people live in our 42 neighborhoods today, representing 4.3% of total population in their 40 host counties. Dramatic population growth in these neighborhoods is not due to growth in student populations at the universities associated with our districts: The average neighborhood grew 31 percentage points more than the student body at the principal university associated with its innovation district. Rather, outsized growth is due to adults voting with their feet and moving in.
- Our 42 innovation district neighborhoods have markedly outperformed surrounding counties and metros for attracting newcomers from out of town, both people from other U.S. states and foreign-born people.
- Our 42 neighborhoods have considerably higher adult population shares with a bachelor’s degree or higher than surrounding counties and metros. Population shares with a bachelor’s degree or higher have also grown slightly faster in these neighborhoods than in other areas since 2010.
- Our 42 neighborhoods significantly outperform other areas for nearby jobs in what the author Richard Florida calls “creative” industries, which typically pay better than another sectors. (See Table 3.)
- Our 42 neighborhoods significantly outperform surrounding counties and metros as well as America as a whole for income levels. To make fair comparisons, we’ve adjusted reported income levels in our innovation district neighborhoods to account for the supersized populations of low-earning university students living there. (See Appendix 1 for a full explanation of our methods.) Based on the measures we show in Table 3, individual income levels are 11% to 22% higher than in surrounding counties and metros, on average, and 15% to 25% higher than national averages.
Table 2
Population growth and educational attainment
| Population | Born Elsewhere, 2024 | % Bachelors+ | Assoc/Some Coll as % of Non-Bach, 2024 |
||||
|---|---|---|---|---|---|---|---|
| 2024 | Growth, 2010-24 |
Different State |
Different Country |
2024 | Change, 2010-24 |
||
| 42 Innovation District Neighborhoods (avg) | 1,994,176 | 52% | 32.9% | 15.8% | 50.2% | 9.3% | 45.8% |
| Same Counties | 55,770,588 | 12% | 29.3% | 14.0% | 43.3% | 45.8% | |
| Same Metro Areas | 119,584,570 | 16% | 29.1% | 12.2% | 41.1% | 8.1% | 46.1% |
| USA | 340,110,988 | 10% | 26.9% | 14.1% | 35.7% | 5.7% | 43.4% |
Table 3
Jobs, incomes, and commuting
| % in Creative Industries, 2024 |
Adj. Income, 2024 | Median Household Income, 2010-24 |
Commuting (mins) | |||
|---|---|---|---|---|---|---|
| Per Cap Income |
Worker Earnings |
Avg., 2024 |
Change, 2010-24 |
|||
| 42 Innovation District Neighborhoods (avg) | 64.3% | $55,699 | $ 53,302 | 89% | 21.3 | 1.1 |
| Same Counties | 58.5% | $46,132 | $ 46,871 | 24.5 | ||
| Same Metro Areas | 56.0% | $46,262 | $ 47,995 | 61% | 25.4 | 2.0 |
| USA | 53.3% | $44,673 | $ 46,151 | 63% | 26.4 | 1.2 |
- Incomes also grew much faster for people in our innovation district neighborhoods than for their peers elsewhere from 2010 to 2024: 89% growth in median household income in the average district compared with 61% in surrounding metros and 63% for the nation as a whole. In inflation-adjusted terms, incomes in our innovation district neighborhoods grew more than twice as fast as in the metros where they’re located, on average.
- While it’s not possible to reach definitive conclusions regarding how much of this edge is due to highly educated people moving in as opposed to income growth for people who have lived in these neighborhoods for a long time, the data offer hints. Comparing the 15 neighborhoods in our dataset that realized 2010-2024 population growth of over 50% – that is, places that have seen a large influx of newcomers – with the 11 neighborhoods that experienced population growth of below 10% or outright shrinkage, we find a striking pattern: The low-growth neighborhoods have lower educational attainment levels than their fast-growing peers – as we would expect if successful innovation districts tend to attract highly educated newcomers – but income growth rates almost identical to the high-growth group and much higher than in their own surrounding metro areas. This suggests that at least some of the outperformance in our 42 neighborhoods reflects better-than-average income growth for longtime residents, not just the effect of highly educated newcomers moving in.
- Average commuting times are considerably shorter in our innovation district neighborhoods, indicating better-than-average job opportunities close by. Commuting times went up in these neighborhoods from 2010 to 2024, but only about half as much as they rose in their surrounding metro areas on average. Just under 10% of working people in these neighborhoods typically walk to work – a far higher share than in surrounding counties or metro areas.
To be clear: Our data measures performance of specific neighborhoods relative to county, metro area, and national benchmarks. It doesn’t measure performance of neighborhoods near an innovation district and a university or academic medical center relative to neighborhoods near universities or medical centers without an innovation district. This means we’re really looking at the effects of being near both an innovation district and an associated university compared with being near neither.
Larger effects than in our 2020 study: Our previous report, which included only data through 2020, found similar effects on each of these metrics. But all these effects have grown more pronounced with four more years of data. Our innovation district neighborhoods are outperforming their surrounding counties and metros as well as the nation as a whole by considerably larger margins than they were in the 2010s.
Our hypothesis is simple: Many of the innovation districts in our previous report’s dataset were relatively new in 2020. Presumably, it takes time for the effects we see in both reports to play out. Innovation districts in existence before 2020 have now had four more years to generate economic effects.
Why some innovation districts outperform others for prosperity and innovation:
- Innovation district age and size: If innovation districts are generating measurable impact, we should expect both older and larger districts to have outsized effects. This is in fact what we see in our data.
- Neighborhoods centered on older, larger districts have significantly higher education attainment levels, creative industry employment shares, and incomes than those surrounding newer, smaller districts. They also have considerably shorter commuting times, presumably reflecting their success in generating quality jobs nearby. In all these respects, our results match what we saw in our previous report. Unsurprisingly, there is a high correlation between being a relatively mature district and being a large one.
- But our addition of new data for 2021-2024 points to emerging trends that cut the other way: Newer, smaller districts have generally seen more in-migration from elsewhere in the United States and faster overall population growth since 2010 than older, larger districts. Some of the oldest, largest districts have also seen a decline in their edge over other areas in commuting times, while smaller districts have maintained or widened their advantage relative to their home metros over time – though their edge remains smaller than for the largest districts. We suspect these trends are closely connected with housing market dynamics, to which we’ll return shortly.
- Metro area size: Innovation districts in the largest metro areas have stronger effects on neighborhood educational attainment, creative sector jobs, and incomes than districts in smaller metros.
- Metro area housing policies: Innovation district neighborhoods in metros with relatively restrictive policy environments for new housing have far underperformed those located in more housing friendly metros for population growth. On the other hand, districts in the metros most unfriendly to new housing have higher average income levels than other districts. This reflects two factors. First, the largest metros in our dataset tend to have relatively adverse housing environments, so this relationship is partly a result of metro size effects. Second, our data suggest that districts in relatively housing unfriendly metros have seen greater displacement of lower-income people than other districts, which has tended to elevate average income levels.
- Innovation district location within its metro area: Districts located in traditional big-city downtowns have seen slower population growth than those based in more outlying areas or smaller college towns. On the other hand, downtown districts have mostly outperformed those in other locations for educational attainment, creative sector jobs, and incomes. There isn’t much difference across locations in income growth rates.
Districts that stand out for their strong performance on these prosperity metrics include the following:
- Tech Square (Atlanta)
- South Lake Union (Seattle)
- uCity Square (Philadelphia)
- Kendall Square (Cambridge)
- University of Utah Research Park (Salt Lake City)
- Pittsburgh Innovation District
- Research Triangle Park (Raleigh-Durham)
- Cortex Innovation District (St. Louis)
b. HOUSING AND NEIGHBORHOOD STABILITY
Overall innovation district performance: Innovation districts are dramatically outperforming their surrounding counties and metro areas as well as America as a whole for housing growth. Even so, surging demand to live in these neighborhoods has pushed home prices and rents well above typical levels for surrounding counties and metros.
Here are the main housing trends we see in the data:
- Our innovation district neighborhoods have seen far faster growth in their housing stock than surrounding counties and metros as well as America as a whole. We see this advantage both in Census estimates of total units for 2010 and 2024 and in significantly higher shares of the housing stock built since 2010 and since 2020 in our innovation district neighborhoods.
- Housing units in our neighborhoods are smaller than in surrounding areas on average, as measured by the number of bedrooms. Almost 60% of housing units are renter-occupied, much higher than the 35% rental share for the United States as a whole.
- Owner-occupied home prices in our innovation district neighborhoods were more than 30% higher than in surrounding areas or the country as a whole in 2024, on average, based on Zillow data.
Table 4
Housing and racial composition
| Growth in Housing Units, 2010- 24 |
% Built Since … | Avg. Zillow Home Price, 2024 |
Gross Rent | Black + Hispanic Pop. Share |
|||||
|---|---|---|---|---|---|---|---|---|---|
| 2020 | 2010 | 2024 | Growth, 2010-24 |
Representative Recent Bldg. |
Total, 2024 |
Change, 2010-24 |
|||
| 42 Innovation District Neighborhoods (avg) | 77% | 2.7% | 17.5% | $553,788 | $1,426 | 81% | $ 1,799 | 37.2% | 0.2% |
| Same Counties | 8% | 2.0% | 12.7% | $352,460 | $1,400 | 71% | 35.3% | ||
| Same Metro Areas | 19% | 2.4% | 13.9% | $338,163 | $1,396 | 69% | 28.5% | 2.8% | |
| USA | 9% | 2.0% | 11.4% | $359,078 | $1,413 | 77% | 31.6% | 2.3% | |
- Apartment rents are about 3% higher than in surrounding counties and metros. Average rents have grown considerably faster in our neighborhoods since 2010 than in their home metros and counties, despite these neighborhoods’ striking success in adding new housing supply. This, together with our neighborhoods’ large home price premium, indicates rapid growth in demand to live near our 42 innovation districts.
- Asking rents in the 27 new representative apartment buildings we’ve identified are about $1,800 per month, on average – 26% higher than mean rents in these neighborhoods. This premium is moderately larger than the typical gap between new and established apartments in the same area of about 15% to 20% (2025 Redifn data). Exceptionally high rents for new apartments are probably more indicative of rent challenges facing our innovation districts than overall average rents, since newcomers coming into a fast-growing area are likely to settle disproportionately in newly built housing.
- About 34% of households in our innovation district neighborhoods were spending more than 35% of their income on housing – a common measure of housing cost burdens – in 2024. By comparison, 29% of households in the nation as a whole as well as in our neighborhoods’ home counties were spending more than 35% of income.
- The evidence suggests there has been a modest degree of displacement of longtime residents of these neighborhoods in recent years. There is no agreed-upon measure of displacement or even a clear definition for the term. We’ve used the combined Black and Hispanic population share in our neighborhoods as an admittedly imperfect proxy, since there has often been a racial overlay to neighborhood displacement in the history of U.S. cities. The combined Black and Hispanic population share in our neighborhoods has increased 0.2% since 2010, on average. However, the combined Black and Hispanic share has gone up 2.3% in the nation as a whole and 2.9% in the metros where our districts are located over the same period, on average. Also, combined Black and Hispanic population shares have fallen in 45% of our innovation district neighborhoods.
Heightened housing worries since our 2020 study: Every housing-related metric we’ve looked at suggests that housing challenges have grown more severe for America’s innovation districts than they were in 2020. Prices for owner-occupied homes in our innovation district neighborhoods have risen from a 16% premium over their own metro area’s average in 2020 to more than 30% today, even as overall prices have surged. Average rents have gone from a slight discount relative to surrounding areas to a modest premium. New buildings command far higher rents than they did in 2020. The share of households spending more than 35% of income on housing has increased faster in our innovation district neighborhoods than it has in their surrounding metros.
Innovation district advantages on commuting times relative to surrounding counties and metro areas have also modestly narrowed since 2020, though they’re still wider than they were in 2010. This probably indicates that more people working in our innovation districts are choosing to live further away for affordability reasons.
Combined Black and Hispanic population shares have also shifted in the 2020s. In our previous dataset, they had risen as much in our innovation district neighborhoods as in surrounding areas. Now a small gap has emerged. Anecdotal media evidence – for instance, from Pittsburgh – provides further evidence of growing displacement pressures near innovation districts over the last several years.
Why some innovation districts outperform others:
- Innovation district age and size: Older, larger districts have seen less housing development, higher home prices and rents, larger rent increases, and greater displacement of Black and Hispanic populations than newer, smaller districts. Our interpretation: America’s most established innovation districts have been extremely successful in creating demand to live nearby. The neighborhoods where they’re located have also added significant new housing, but not enough to keep up with surging demand. Very high housing prices have in turn caused growing displacement. Newer, smaller districts have generated less demand so far, but they’ve also seen greater housing growth.
- Neighborhoods surrounding older, larger districts additionally have much higher shares of employed people working remotely than less-developed districts, even though they’re more likely to be located in dense downtown areas than their smaller peers. This is probably because it’s harder to commute by automobile in these neighborhoods, which also see higher shares of workers walking to work or taking public transit.
- Metro-area size: Housing supply growth has been roughly even across districts in large, medium-sized, and smaller metro areas. Home prices and rents are much higher in districts located in large metros, both because overall housing costs are highest in large cities and because innovation districts in large metros seem to have had larger demand-generating economic effects than their peers in smaller metros.
- Metro area housing policies: Innovation district neighborhoods in metros with relatively housing-friendly policies have far outperformed those in more restrictive metros for adding new housing units. Housing growth in these neighborhoods has helped to contain appreciation in prices and rents, hold down housing cost burdens, and avoid displacement. These neighborhoods have also seen less increase in commuting times since 2010 than innovation district neighborhoods in more restrictive metros.
- Innovation district location within its metro area: Districts located in traditional urban downtowns have performed better than those in peripheral urban areas, suburbs, or smaller college towns in adding new housing. Nonetheless, they see much higher prices and rents than districts in other locations. In our view, this mostly reflects the overall price premium typically associated with downtown living, but it may also reflect economic outperformance by these districts relative to districts in other locations.
- Districts in downtown locations enjoy shorter commuting times than other districts, but this edge has narrowed since 2010, presumably reflecting the effects of very high housing prices on people who work in these districts.
Districts that stand out for their strong performance on our housing and neighborhood stability metrics include the following:
- Pegasus Park (Dallas)
- Cleveland Health-Tech Corridor
- Tech Parks Arizona (Tucson)
- Research Triangle Park (Raleigh-Durham)
- Pete Innovation District
- Winston-Salem Innovation Quarter
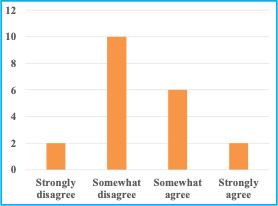
Are housing challenges holding innovation districts back? Our survey presents a mixed picture on how housing challenges are affecting the growth of innovation districts. Eight of the 20 responding districts indicated that they “strongly agree” or “somewhat agree” with the statement: “Housing supply and affordability problems are constraining the growth and success of our innovation district.” (See Figure 8.) Only two of these, however, say they “strongly agree,” and only two of them expressed disagreement with the statement: “Housing within a 15-minute commute (driving, walking, etc.) is reasonably abundant and affordable for people working in our innovation district.”
Perhaps surprisingly, the eight districts reporting that housing issues are holding back their growth and success are disproportionately located in smaller college towns or midsized cities, though RTP in the relatively large Raleigh-Durham area is also in this group. Districts in the largest cities tended to disagree with the statement.
This pattern, however, is consistent with a takeaway from our data: Our innovation district neighborhoods that are located in smaller college towns have seen considerably less housing development than those in large cities, both since 2010 and since 2000. Home prices and rents are cheaper in our college towns, but incomes are lower too. Slightly larger percentages of households are housing cost-burdened in our college town neighborhoods than in our innovation district neighborhoods located in large cities. This finding is also consistent with a 2026 Redfin report showing that noncoastal college towns are experiencing considerably higher home price appreciation than the country as a whole.
Also, our data suggest that housing challenges might be constraining growth in several of the innovation district neighborhoods that are among the most expensive in our dataset but didn’t respond to our survey. These include Kendall Square, Boston’s Longwood Medical Area, and Chicago’s University Tech Park, all of which have seen population and housing growth well below average for our 42 districts despite their tremendous success in generating creative-sector jobs and high incomes.
c. ACCELERATING INNOVATION
Our data confirm that America’s innovation districts are successfully creating thriving urban places where innovative firms and “creative” people seek to live and work – one of the two chief reasons why cities, developers, and eds and meds institutions are building them. Whether innovation districts are accelerating actual innovation relative to what would happen if innovative firms and creative workers were more geographically dispersed – the other purpose for innovation districts – is much harder to measure. We have not designed our analysis to measure it.
Figure 8
Are housing issues holding innovation districts back?
(Agree/disagree with the statement:”Housing supply and affordability problems are constraing the growth and success of our innovation district.”)
Source: George W. Bush Institute survey of 20 innovation districts (April-July 2026)
We nonetheless offer four observations that suggest positive effects on innovation:
First, leading-edge innovation in the 2020s has continued to take place in extremely concentrated places, with much of it in formally defined innovation districts and science parks.
- Top AI labs are developing frontier large language models (LLMs) primarily in just five locations: downtown San Francisco and the nearby Mission Bay neighborhood (Anthropic and OpenAI headquarters); Mountain View, California (Google’s headquarters); Seattle’s South Lake Union (a second major Anthropic facility); the Knowledge Quarter district in London’s King’s Cross area (Google DeepMind headquarters and a second major OpenAI facility); and Beijing’s Haidian District (headquarters for all of China’s leading LLM labs: Moonshot AI, Zhipu AI, Baidu, and ByteDance). All of these locations except the San Francisco Bay area are formally defined innovation districts.
- uCity Square and its surrounding area have emerged as the premier center for cell and gene therapies.
- Genomics research and genomics-driven biopharmaceutical R&D is concentrated in Kendall Square, the University City district near the University of California, San Diego, and a cluster of science parks in Cambridge, U.K.
- Cutting-edge semiconductor design and manufacturing R&D are increasingly located in a handful of locations as well: innovation corridors in Santa Clara, California, and adjacent localities in the heart of Silicon Valley (Nvidia, Advanced Micro Devices, Qualcomm, Intel, and Apple); Taiwan and South Korea (Taiwan Semiconductor Manufacturing, Samsung Electronics, and SK Hynix); and the science parks in Cambridge, U.K. (Arm, Microchip Technology, Qualcomm, Intel, and Apple).
Second, leading-edge firms keep voting with their feet. Tenants in America’s innovation districts – including ones far from premier centers in Boston-Cambridge and the San Francisco Bay area – are signing leases in innovation districts at rents some 25% higher than the average for the same counties and metro areas. Presumably they believe they are benefiting from conducting R&D activities in these locations. It is unlikely, we suggest, that they would pay so much more just to give their employees the premium amenities that are sometimes available within innovation districts.
Also, companies outside the industries most closely associated with frontline innovation are increasingly setting up R&D facilities within innovation districts, even though their employees likely would have no expectation of working in such settings. Examples include Caterpillar and John Deere at the University of Illinois Research Park in Champaign, Illinois; Delta Airlines in Tech Square; Boeing in the Cortex Innovation District; and Fidelity Investments in RTP. The ongoing growth of facilities like these suggest that tenants are reaping benefits from being there.
Third, America’s smaller college towns have generally experienced a significant economic boom for at least the last two decades, even though many lack the range of quality-of-life amenities available in large cities. (See our earlier report on eds and meds institutions.) Growing populations of innovation-focused firms and highly educated people in these places may represent evidence for actual innovation benefits from geographic clustering.
And fourth, the rise of innovation districts since the mid-2010s has coincided with an acceleration of U.S. productivity growth, which many economists view as evidence for accelerating innovation in the nation’s economy. This relationship is of course just a correlation, with causality – if it exists – pointing in both directions.
6
CONCLUSION
America’s innovation districts are succeeding as economic development engines. The 42 districts in our dataset are mostly performing very well, regardless of size, age, or location. Most of them are seeing rapid growth in firms and people working there as well as in populations of highly educated people living nearby. Many are helping produce breakthrough innovations. A majority are planning for substantial growth in coming years. And cities across the United States – and the wider world – are launching many new innovation districts, research parks, and science parks.
But this report also highlights several challenges facing many U.S. innovation districts:
- Developers have overbuilt office and lab space, particularly dedicated life science real estate, in several metro areas. Remote work, weak venture capital activity in the life science sector, falling government research funding, and slow growth in working populations as a result of federal immigration policies are constraining demand growth. Some districts and parks have uncomfortably high vacancy rates, even if they’re mostly outperforming office and lab real estate in their surrounding market.
- Growing demand to live near innovation districts is putting growing pressure on nearby housing markets. Housing challenges are now far more pronounced than they were when we wrote our previous report based on 2020 data. Almost half the district leaders in our survey say that housing availability and price are constraining the growth and success of their innovation districts. Even for other districts, it seems likely that steep increases in home prices and rents will become a top-of-mind issue for more and more people working in or near the district.
- There’s considerably more evidence of displacement of longtime residents near innovation districts than there was just six years ago. If this effect becomes more pronounced, innovation districts will likely face growing neighborhood pushback in coming years.
- Some innovation districts have grown in unbalanced ways, adding substantial office and lab space but little in the way of restaurant, bar, coffee shop, and greenspace amenities that high-skilled workers increasingly expect – despite the fact that virtually all districts say they aim to create vibrant live-work-play environments.
- Some districts face growing challenges from inadequate power and other physical infrastructure.
We believe innovation district leaders as well as local policymakers in cities hosting innovation districts will face growing market pressures to address these issues.
a. TAKEAWAYS FOR INNOVATION DISTRICT LEADERS
Our analysis has straightforward takeaways for innovation districts. District leaders should understand the demand dynamics in their area and be careful to expand in financially sustainable ways. Some will likely find it necessary to adjust their growth plans downward in view of high current and projected vacancy rates.
Most districts would benefit from balanced growth plans that incorporate more restaurants, coffee shops, greenspace, and other valued amenities. Most would also benefit from stepped-up programming benefiting district tenants and their employees, stronger systems of shared governance, and enhanced engagement in surrounding neighborhoods.
Many district leaders will also need to get involved in addressing housing supply and affordability issues surrounding their districts. Our data suggests that housing issues are affecting the growth of more and more districts, particularly since 2020. Some innovation districts and research parks – like RTP – have sufficient land to allow for significant housing and mixed-use development within their boundaries. Most do not, and it’s unlikely that more than a handful of district developers and governance organizations will choose to develop new housing themselves. But most district leaders are positioned to influence land-use decisions in nearby neighborhoods. Farsighted leaders will likely take a growing interest in the development of surrounding areas, especially as regards housing for people working in the district.
b. TAKEAWAYS FOR POLICYMAKERS
Federal, state, and local policymakers should encourage the ongoing growth of innovation districts and the creation of new ones. Innovation districts and research parks have clearly emerged as a successful experiment in regional economic development policy, especially over the last decade or so.
State and local governments can promote current and new innovation districts through land grants, supportive land-use policies, and direct financial support, as we’ve highlighted in this report. They can also advance wider local innovation ecosystems by supporting local research universities, which in some cases are the prime movers behind innovation districts and invariably play an important role.
Local governments should also allow rapid housing expansion in neighborhoods surrounding fast-growing districts. The best thing they can do is to move toward-growth friendly housing and land-use policies throughout their localities, since housing markets everywhere are interlinked, as we show in a 2025 report. But some cities with relatively restrictive policies have in recent years introduced reforms to allow more intensive housing and mixed-use development in particular areas, especially near transit stops. They should similarly permit more intensive development near universities and innovation districts.
As for federal policymakers, America as a whole has benefited from the geographic expansion of cutting-edge innovative activities beyond longtime hubs in the Northeast, upper Midwest, and West Coast into up-and-coming areas, especially in the Sun Belt. In the last decade, growing innovation ecosystems surrounding eds and meds institutions have played a pivotal role in reviving economic growth and opportunity in several Rust Belt metro areas as well, including Detroit, Columbus, Indianapolis, Pittsburgh, and others. Congress has encouraged these trends above all through large-scale university research funding but also through occasional place-based policies like the Economic Development Administration’s Tech Hubs program and the NSF’s Regional Innovation Engines initiative.
Congress should remain committed to U.S. preeminence in science and technology and should continue to invest in research, workforce training, and physical development in innovation districts and other local innovation ecosystems.
America’s innovation districts are a national success story, increasingly emulated by other countries around the world. They have become even more powerful economic development engines in the 2020s, our data shows. If federal, state, and local policies remain sufficiently supportive, innovation districts will play a vital role in the nation’s future economic growth.